












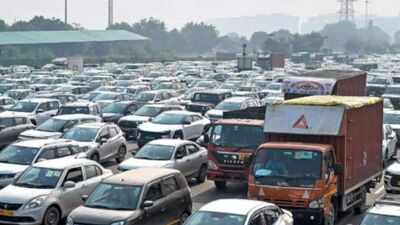
Barricades and checkpoints could become a regular sight as Delhi bars non-BS-VI vehicles registered outside the city. While most borders saw little congestion Sunday, Gurgaon and Ghazipur saw tailbacks. TOI’s Ishita Jairath crunches ground estimates to calculate the fuel consumed and CO2 emissions generated by vehicles idling in these queues. The big question: How much CO2 is being released by vehicles waiting with their engines running?
Air pollution calculations
Average co₂ emissions per vehicle: approximately 30.7 grams per minute of idling.Waiting time varies depending on where vehicles are positioned in the tailback. While some commuters may get through within 10 minutes, those further back could remain stuck for 15–20 minutes.
Gurgaon border
Estimated tailback: 400 carsApprox co₂ emissions per minute: 12.3 kgIf vehicles idle for:
- 10 minutes: around 123 kg (0.123 metric tonnes) of co₂.
- 15 minutes: around 184 kg (0.184 metric tonnes) of co₂.
- 20 minutes: around 245 kg (0.245 metric tonnes) of co₂.
Ghazipur border
Estimated tailback: 30–40 vehiclesApprox co₂ emissions per minute: 0.9–1.2 kgIf vehicles idle for:
- 10 minutes: 9–12 kg of co₂.
- 15 minutes: 14–18 kg.
- 20 minutes: 18–25 kg.
Air pollution calculation
The us energy information administration states that burning one us gallon of gasoline produces approximately 8,887 grams of co₂. Since one us gallon is approximately 3.785 litres, this translates to around 2.35 kg of co₂ per litre of petrol burned.Emissions assumed: burning one litre of petrol releases approximately 2.3 kg of co₂.
Calculation methodology
- Fuel consumed per minute = number of vehicles × 0.8 litres ÷ 60.
- Co₂ emissions per minute = fuel consumed × 2.3 kg.
- Emissions over the waiting period = per-minute emissions × number of minutes.
Note: these estimates are based on available data, ground assessments and general assumptions. Actual figures may vary depending on vehicle models, engine capacity, fuel type, maintenance, idling conditions and time spent in queues. The estimates represent a hypothetical continuous-idling scenario.
Assumptions
- All vehicle engines were assumed to be running.
- All vehicles were assumed to be petrol cars.
- Each car was assumed to consume 0.8 litres of petrol per hour while idling, equivalent to approximately 13.3 ml per minute.
- Vehicles were assumed to be stationary and continuously idling during the calculated waiting period.
- Waiting periods of 10, 15 and 20 minutes were used for illustrative calculations, as actual waiting times varied depending on the vehicle’s position in the tailback.
Expert opinions
“Tailpipes dump toxic gas straight into our lungs at street level, and while clean vehicles help stop that poison, they continue to resuspend fine road dust into the air. Cleaning our air takes more than changing vehicle technology. It demands dust-free roads in our cities and unified action across state borders. Air has no boundaries, and northern india cannot solve a regional health crisis with isolated city-level band-aids.”— Shreya GadepalliMobility expert“A seamless transition requires automated enforcement, well-equipped peripheral holding areas, synchronised inter-state logistics, real-time tracking, and clear phase-in support for operators.”— Anumita RoychowdhuryExecutive director-research and advocacy, centre for science and environment